Click on an entity tab in the UEBA page.
You can explore raw events in two ways:
Hover over the More (
) menu and click Explore Raw Events.
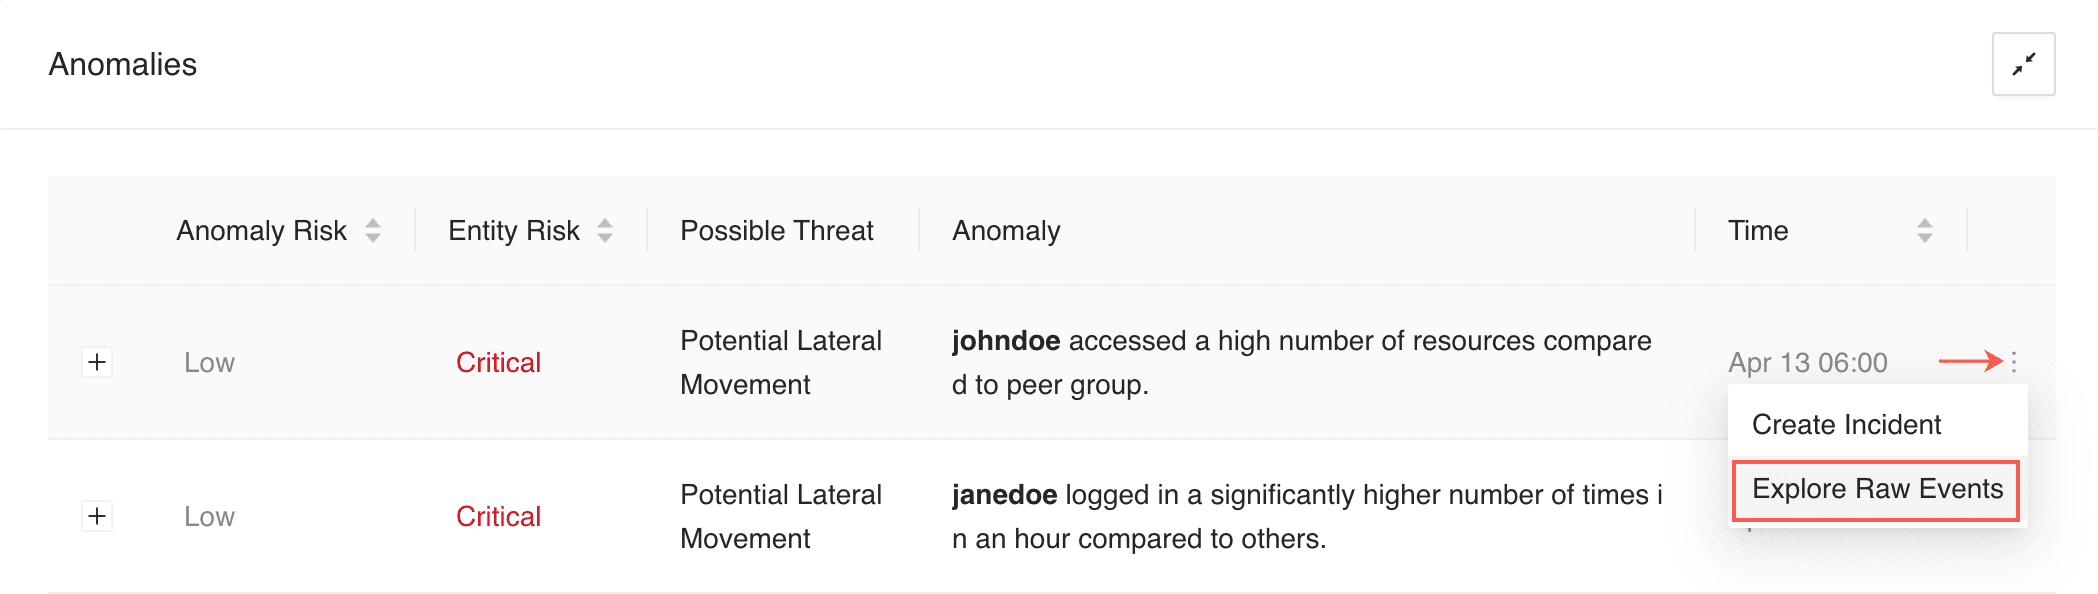
Exploring Raw Events From the More Menu
Click the Expand (
) button of an anomaly and click Explore Raw Events.
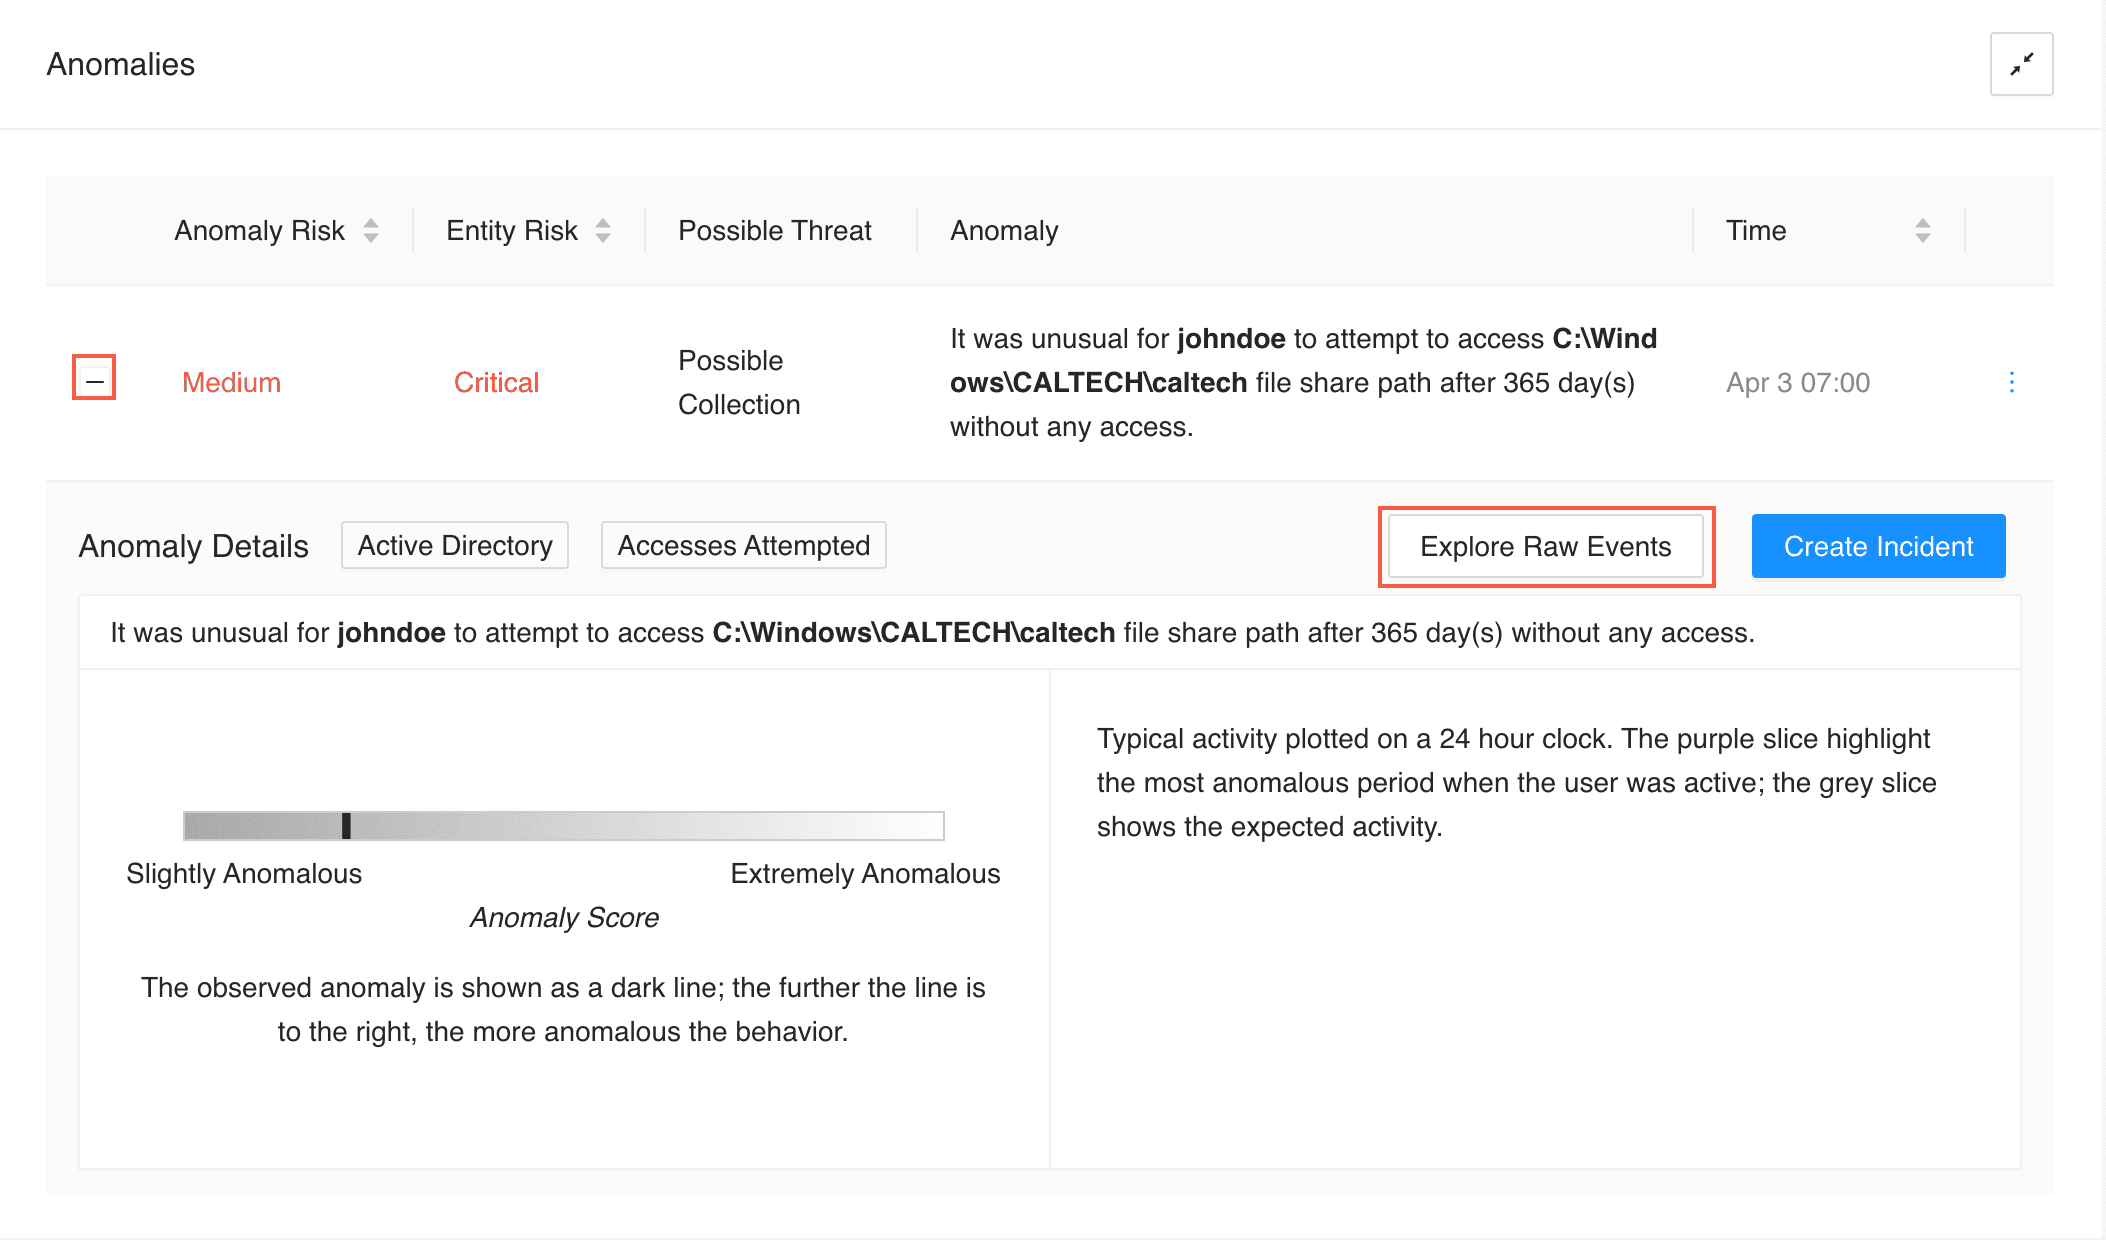
Exploring Raw Events From the Expand Button
Click Explore in UEBA to get more details on any of the following fields.
user
userPrincipleName
sAMAccountName
host
share_path
destination_address
server
share
website
domain
resources
source_address
SI_USER
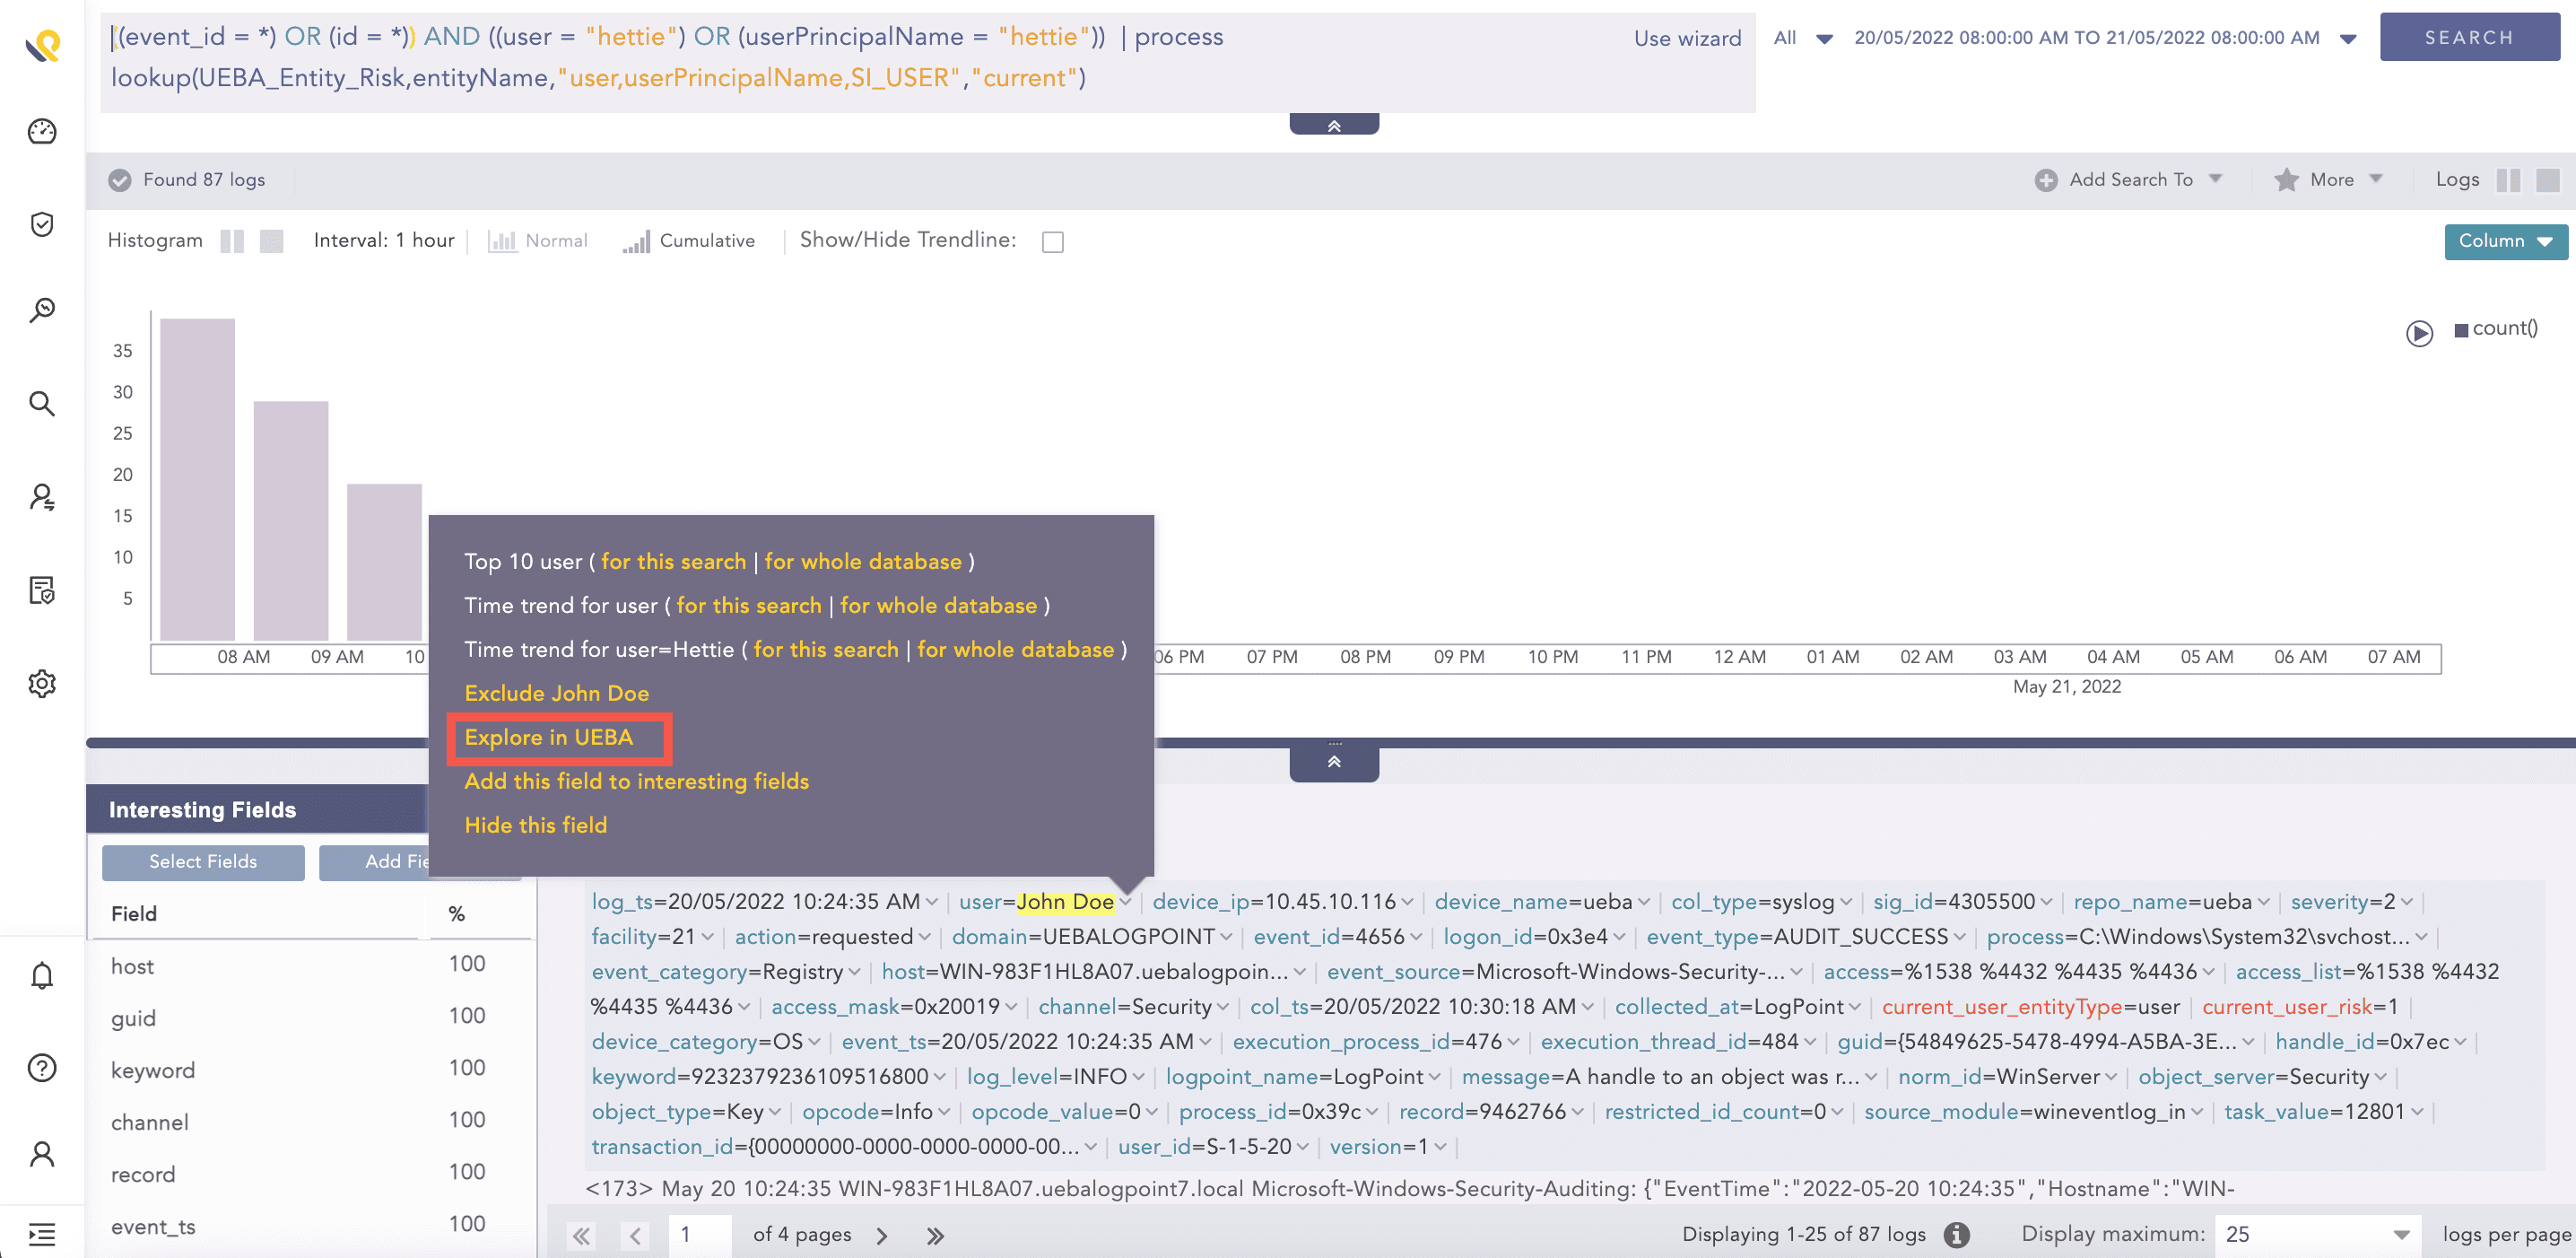
Expand the UEBA Field
You are re-directed to the UEBA page with the value of the field as the filter. If the start_ts and end_ts fields are present in the event logs, UEBA applies the time range filter according to the value of these fields. Otherwise, UEBA applies the time range filter of seven days from the date UEBA ran the analytics.
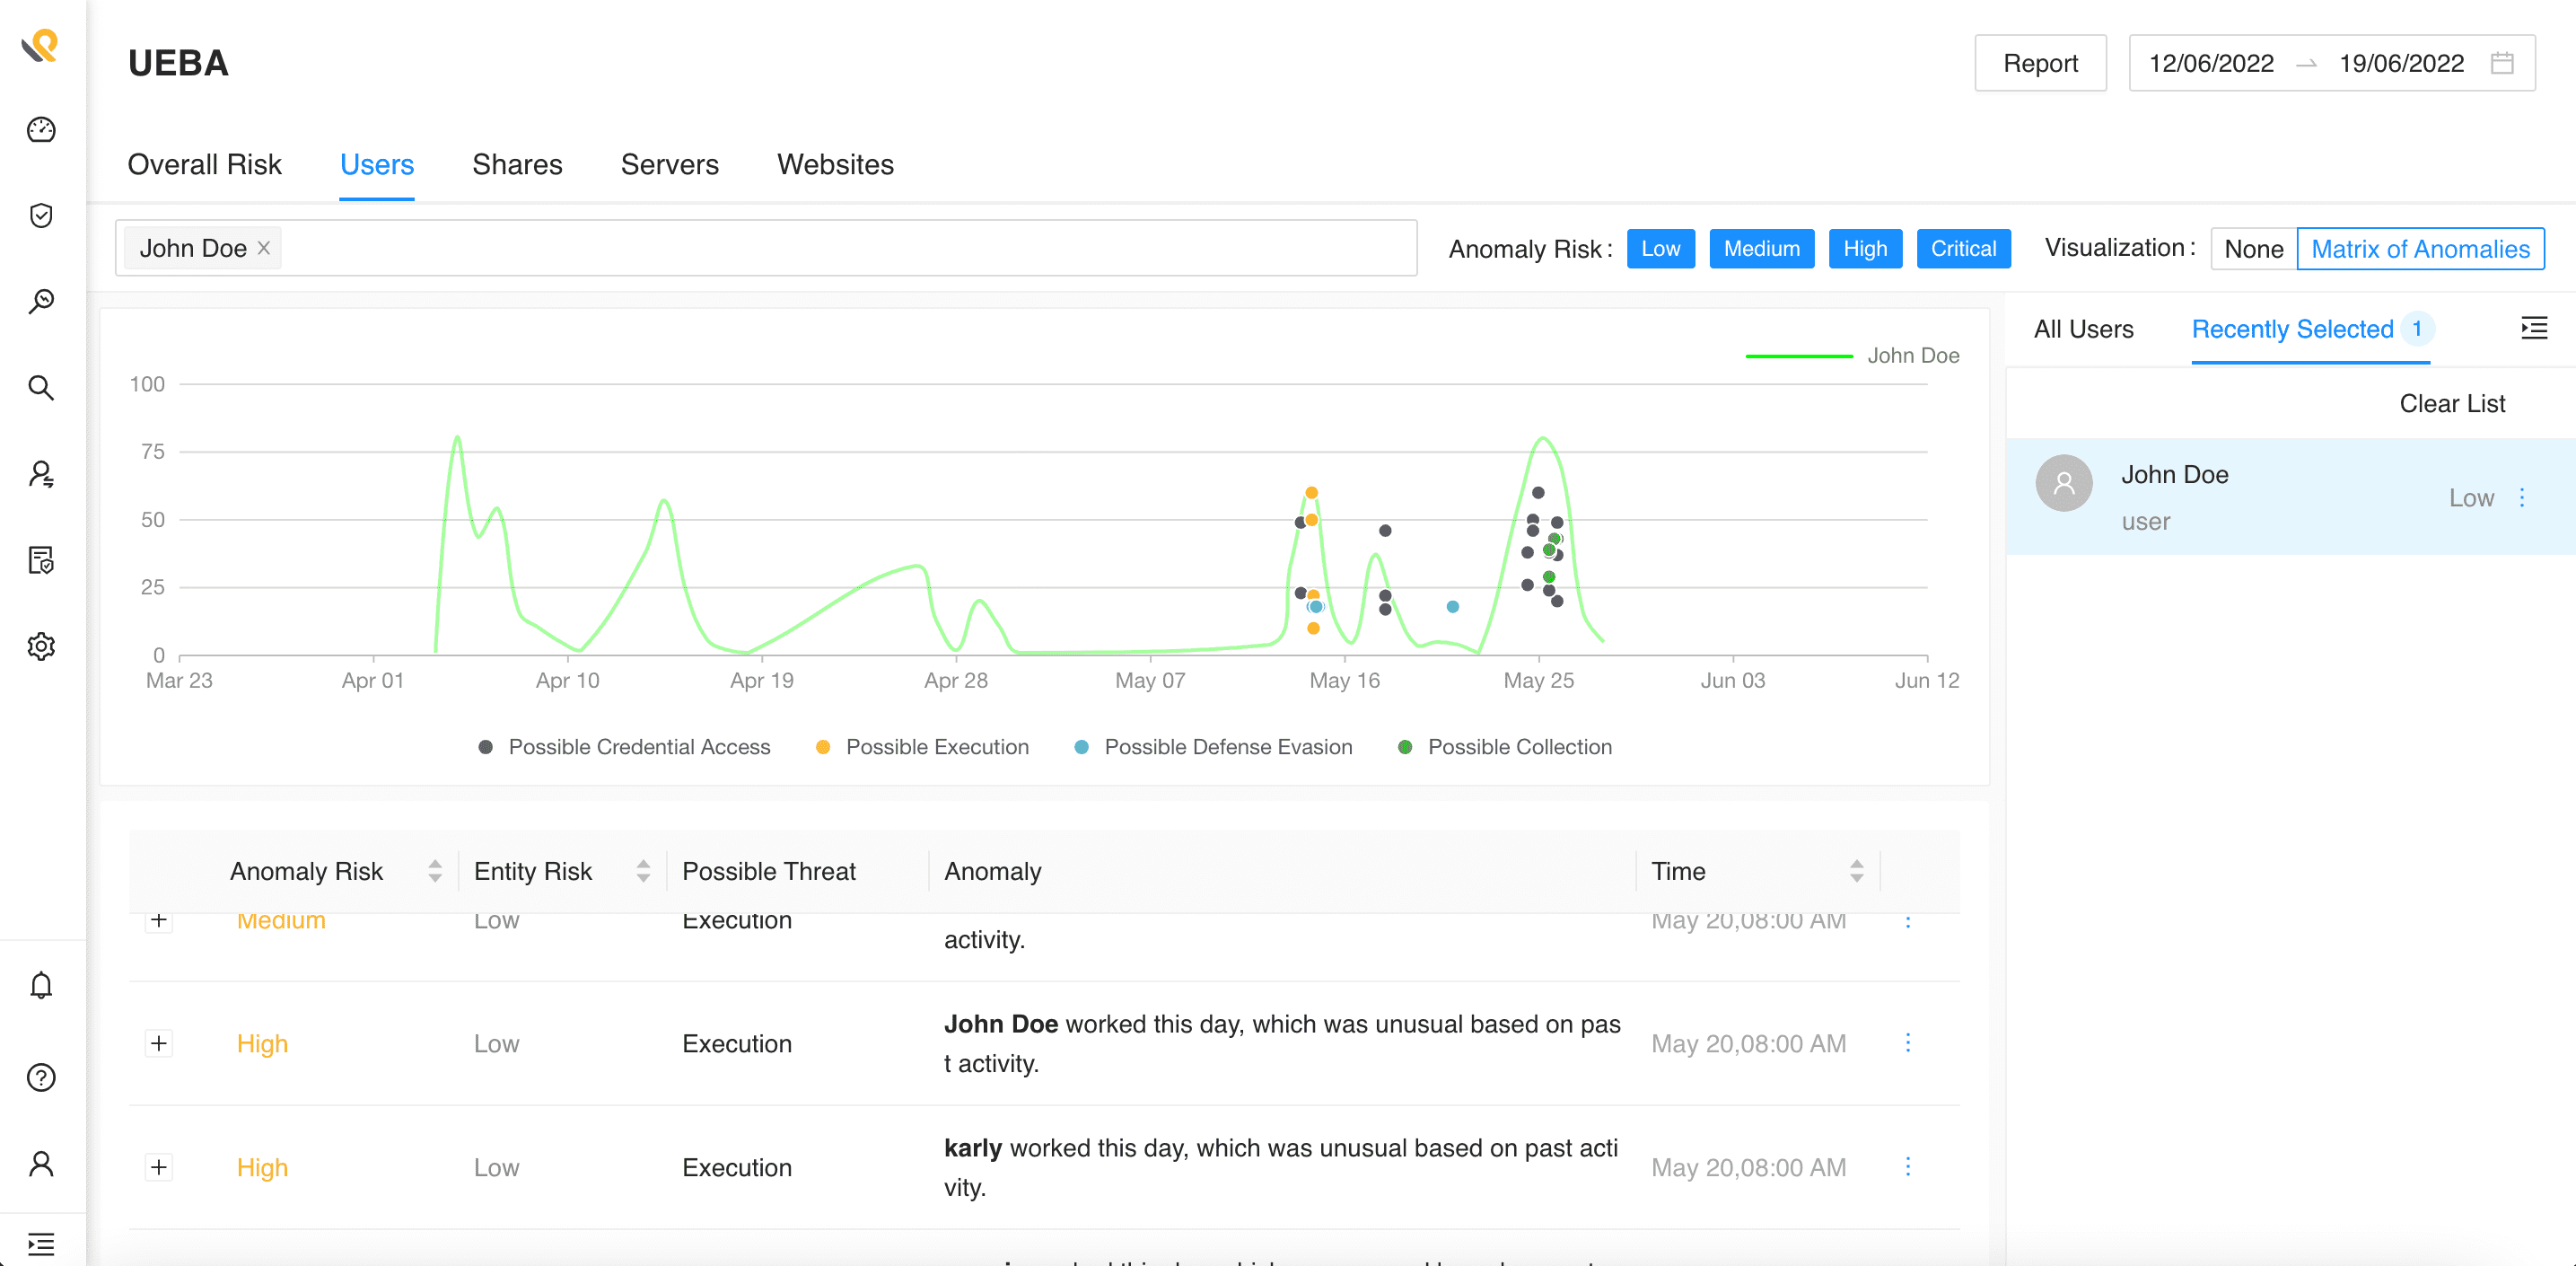
Going Back to the UEBA Page